Posts

Greece: Agriculture Subsidy

Image
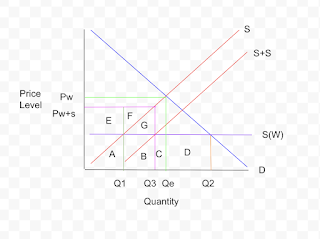
 Greece has come to an agreement with the EU to provide a 1billion Euro subsidy to Greek farmers and the agriculture sector. Using the graph below, let's say that before the subsidy Q2 amount of agricultural products were being consumed at the price of Pw while domestic production was Q1 and imports were Q1-Q2. However after the subsidy the domestic supply curve was moved to the left becoming S+S. However the demand remains at Q2 and the price at Pw. Now the domestic producers increase their production from Q1 to Q3. This means that they are receiving more revenue. Therefore the subsidy policy is beneficial for the domestic producers. For foreign producers, they are now producing less, from Q3-Q2. This means that they have a fall in their revenues. Thus this policy is detrimental for foreign producers. For domestic consumers, their tax euros are the funding for this large subsidy. To be able to support this large subsidy, the government will most likely need more tax revenue result

Greece Fiscal Policies

 Greece is trying to help increase aggregate demand, the government was discussing cutting taxes for businesses. Another item discussed was increasing social spending. Social spending is government funds going to help the population with things such as living conditions, health insurance, etc. This was presented from the government as well. Both of these items are thinking of being implemented because Greece recently started to recover from a decade long debt crisis which happened due to too much government spending. The cutting of taxes for businesses will spur more investments from companies which will increase productivity and help lower unemployment rates in Greece. Which are two large reasons that they had a large economic recession in past years. From 2018-2021 their government debt has increased by 35,000 EUR million. It would make sense for the government to raise taxes instead, however this large increase in debt is probably slowing down Greece's economy and on top of reco

Greece: Long Run Aggregate Supply Curve Shift

GDP per hour worked (2009 - 2019) (OECD) 2009 $39 2010 $39 2011 $36.30 2012 $34.80 2013 $34 2014 $33.70 2015 $34.40 2016 $33.10 2017 $33.50 2018 $33.60 2019 $33.90 GDP per hour lowers which means that the curve shifts to the left because there is a decrease in workers therefore a decrease in productivity Birth rate (World Bank) 2008 1.50% 2009 1.50% 2010 1.48% 2011 1.40% 2012 1.34% 2013 1.29% 2014 1.30% 2015 1.33% 2016 1.38% 2017 1.35% 2018 1.35% decrease in birth rate for a bit then in 2014 it increases a little decrease in quantity which would shift the curve to the left because there is less population to supply Education (OECD) Greece has the highest enrollment rates in bachelor’s programs within the countries studied by the OECD among 18-24 year olds Between 2008-2018 there was an increase in college education among 25-35 year olds 28% - 43% Observations This means that the increase in higher education which shifts it to the right This is because more educated workers will be more

Post 1

Real GDP for the last 10 years (OECD) 2010 0.31M USD 2011 0.29M USD 2012 0.28M USD 2013 0.28M USD 2014 0.29M USD 2015 0.29M USD 2016 0.30M USD 2017 0.31M USD 2018 0.32M USD 2019 0.33M USD 2020 0.30M USD Real GDP per capita for the last 10 years (OECD) 2010 27.93k USD 2011 25.67k USD 2012 24.91k USD 2013 25.95k USD 2014 26.64k USD 2015 26.72k USD 2016 27.47k USD 2017 28.64k USD 2018 29.68k USD 2019 30.87k USD 2020 28.39k USD Real GDP growth per year for the last 10 years (World Bank) 2009 -4.301 2010 -5.479 2011 -9.132 2012 -7.3 2013 -3.241 2014 -0.74 2015 -0.438 2016 -0.191 2017 1.505 2018 1.934 2019 1.871 Unemployment rate in the last 10 years 2010 12.71% 2011 17.87% 2012 24.44% 2013 27.47% 2014 26.49% 2015 24.90% 2016 23.54% 2017 21.49% 2018 19.29% 2019 17.31% 2020 16.85% Inflation rate in the last 10 years (Statista) 2009 1.35% 2010 4.70% 2011 3.12% 2012 1.04% 2013 -0.85% 2014 -1.39% 2015 -1.09% 2016 0.01% 2017 1.14% 2018 0.77% 2019 0.52% Current account balance in the last 10 years